Analyzing Spending Patterns Reveals Early Warnings in Gaming Habits
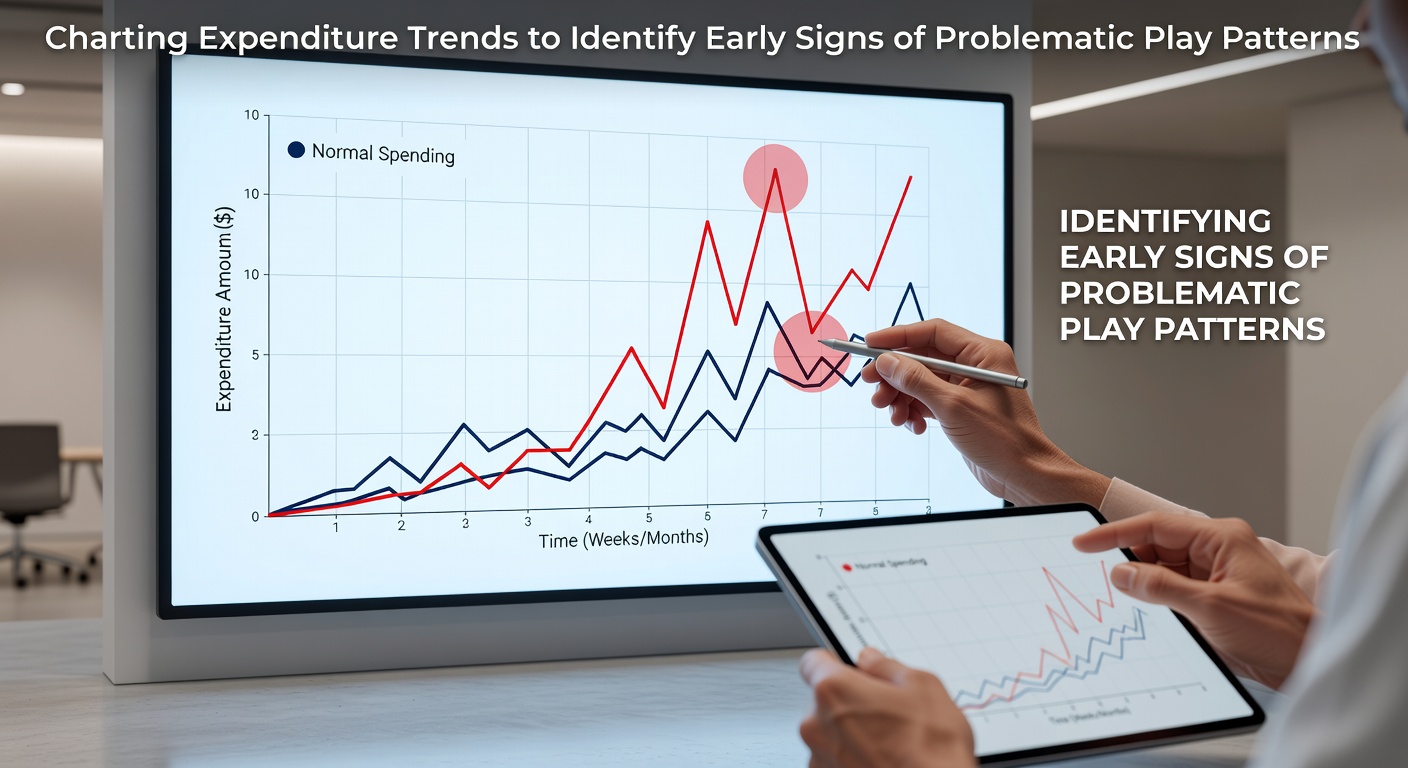
Charting expenditure trends involves systematic recording of money spent on gaming activities across consistent time intervals, and this method allows observers to detect shifts before they escalate into more serious concerns. Researchers have documented how regular data collection over periods of weeks or months highlights incremental changes in outlay that single-session reviews often overlook. Data from multiple jurisdictions shows that individuals who maintain detailed logs experience greater awareness of their habits, and this awareness stems directly from visual representations such as line graphs or bar charts that plot weekly or monthly totals.
Core Elements of Effective Tracking Systems
Effective systems begin with basic categories that separate different forms of expenditure, including deposits, in-game purchases, and subscription fees, while also noting the frequency of each transaction. Observers note that combining these figures with session duration creates a fuller picture because isolated spending amounts rarely tell the complete story on their own. Studies conducted by academic teams in Canada demonstrate that participants who log both amount and time spent identify accelerating patterns earlier than those who track only one metric.
Software applications and spreadsheets serve as primary tools for this process, and many platforms now integrate automatic export features that pull transaction histories directly from operator accounts. Those who've implemented such tools report reduced manual effort, yet accuracy still depends on verifying imported data against bank statements because discrepancies can arise from promotional credits or bonuses that appear as negative entries.
Recognizable Patterns That Signal Potential Concerns
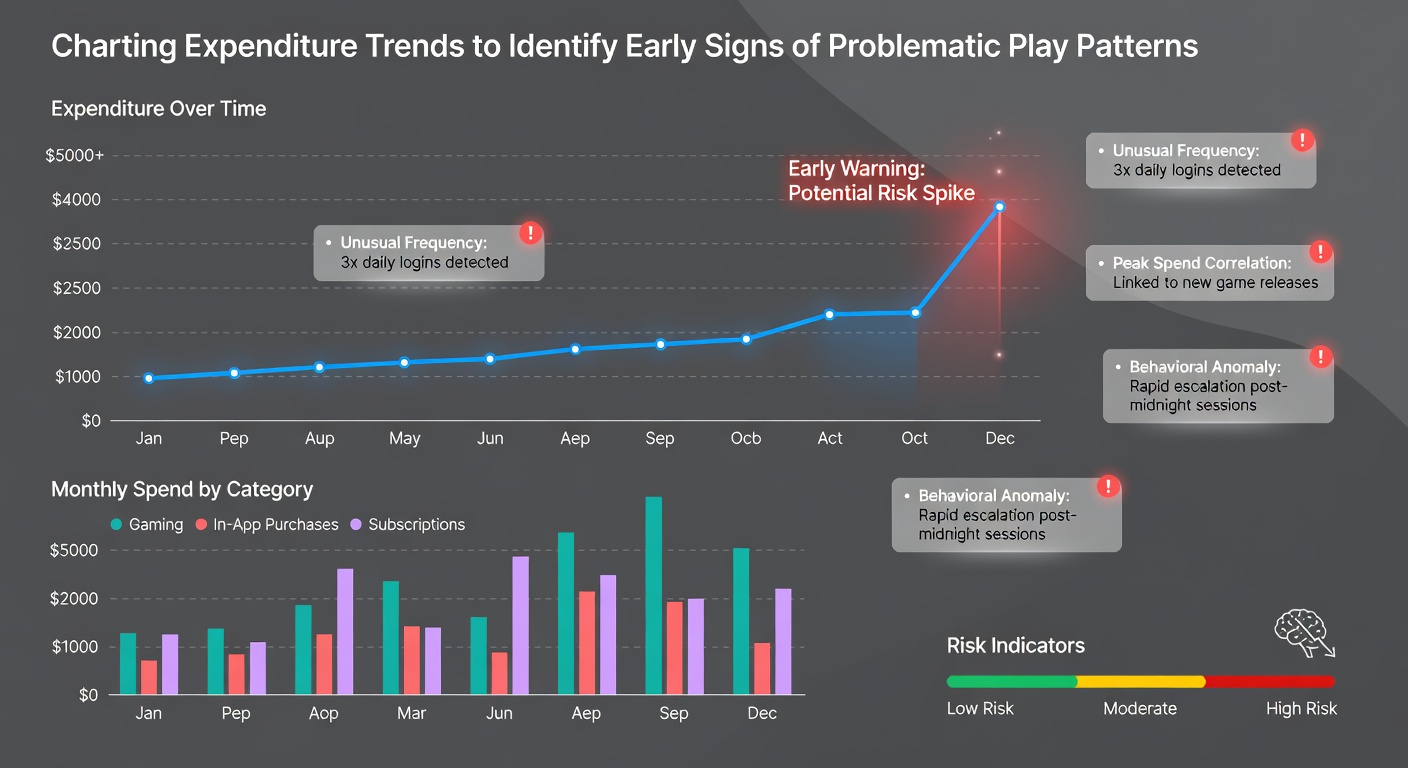
One pattern that surfaces repeatedly in research involves steady month-over-month increases exceeding 20 percent, and this threshold appears across datasets collected by organizations monitoring player behavior in Australia and the United States. Another indicator emerges when spending spikes coincide with specific triggers such as weekends or paydays, whereas consistent baseline activity remains flat during other periods. Evidence suggests these rhythmic surges warrant closer examination because they can reflect habitual responses rather than deliberate choices.
Researchers have also identified clustering effects where multiple high-expenditure days occur within short windows, and this concentration often precedes longer sessions that extend beyond original plans. According to findings from the Victorian Responsible Gambling Foundation, players displaying three or more such clusters within a quarter show elevated rates of subsequent help-seeking behavior compared with those whose activity remains evenly distributed.
Methods for Visualizing and Interpreting Data
Simple line charts connect successive data points to illustrate direction and velocity of change, while moving averages smooth out daily fluctuations to emphasize underlying trajectories. Analysts recommend overlaying trend lines with control bands set at one or two standard deviations from the mean because deviations beyond these bands draw attention to anomalies that merit review. Color coding further enhances readability when red markers highlight days or weeks that exceed personal thresholds established during calmer periods.
Heat maps offer an alternative view by shading calendar dates according to spending intensity, and this format quickly reveals whether increases cluster around particular events or remain sporadic. Those who maintain such visualizations for six months or longer gain perspective on seasonal variations that might otherwise be mistaken for emerging problems. Reports released in early 2026 by research groups tracking North American markets confirm that seasonal adjustments improve the reliability of alerts generated by automated monitoring systems.
Integration With Broader Behavioral Indicators
Expenditure data gains additional value when cross-referenced with other metrics such as frequency of logins, changes in game selection, and responses to limit-setting prompts. A study published through the National Council on Problem Gambling in the United States found that combining spending velocity with login frequency improved early identification rates by approximately 30 percent over spending data alone. This combined approach works because isolated metrics can produce false positives while multiple converging signals strengthen confidence in the observed trend.
Operators in several regulated markets have begun providing players with personalized dashboards that surface these combined indicators automatically, and uptake of such features has increased steadily through the first half of 2026. The dashboards typically include optional goal-setting functions that let users define acceptable ranges in advance, after which the system flags departures without requiring constant manual review.
Conclusion
Systematic charting of expenditure trends equips individuals and support networks with objective records that highlight shifts at stages when adjustments remain feasible. Continued refinement of visualization techniques and integration with complementary data streams continues to strengthen the precision of these early-warning methods across different regulatory environments.