Decoding Payout Frequency Patterns Across Progressive Jackpot Networks
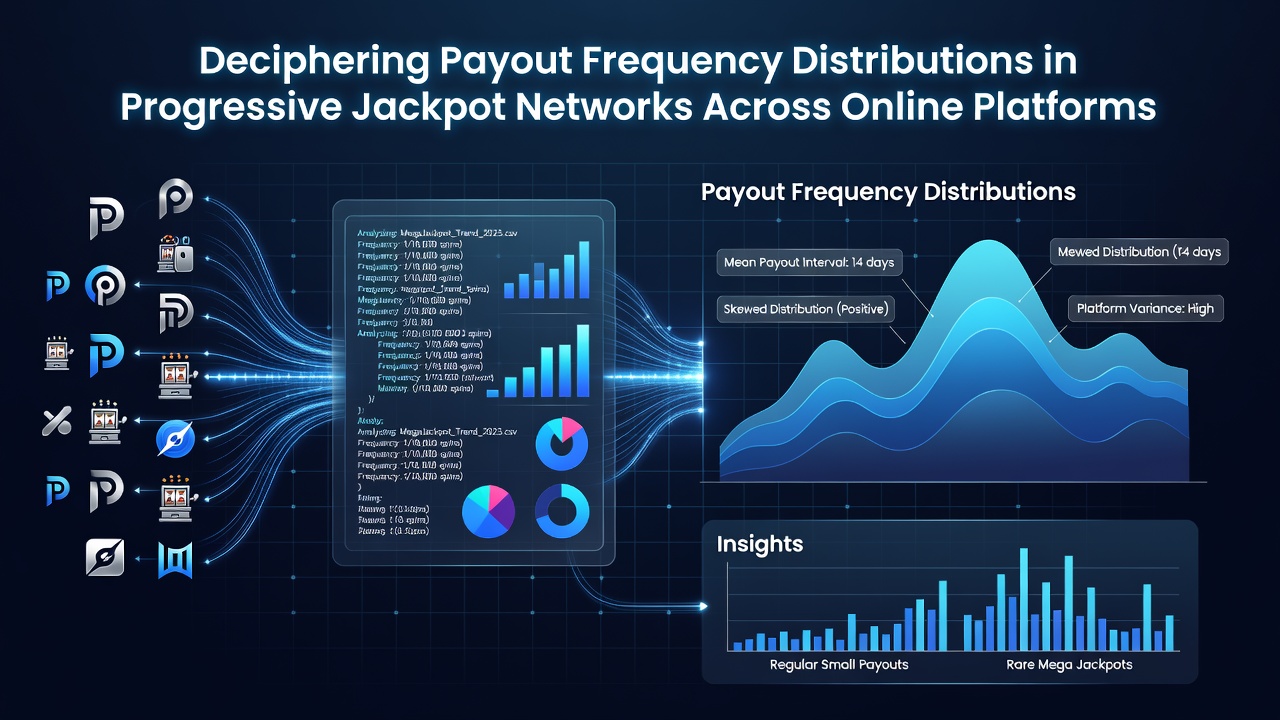
Progressive jackpot networks link multiple online platforms into shared prize pools that grow with each bet placed, and researchers track payout frequency distributions to understand how often these jackpots trigger. These systems rely on random number generators calibrated to specific hit rates, while contribution percentages from wagers feed the growing totals until a qualifying combination appears.
Network Mechanics and Data Collection
Operators pool contributions from slots and table games across sites, which creates larger jackpots but also spreads payout events over wider player bases. Data shows that frequency depends on factors like seed amounts, increment rates, and the total number of connected machines or virtual reels. Analysts collect timestamped win records along with bet volumes to map intervals between payouts, and these logs reveal clusters or gaps that statistical models then quantify.
Studies from regulatory bodies in North America highlight how multi-site networks alter single-site patterns. The Nevada Gaming Control Board publishes aggregated reports on jackpot activity that allow comparisons across different operator groups, while similar datasets from the Alcohol and Gaming Commission of Ontario track contribution flows and trigger events in Canadian markets.
Statistical Approaches to Frequency Analysis
Frequency distributions often follow exponential or Weibull models because each spin carries an independent probability of hitting the required sequence. Experts apply survival analysis to estimate time-to-win metrics, and they adjust for varying stake levels since higher bets sometimes unlock additional paylines or bonus multipliers that change the effective odds.
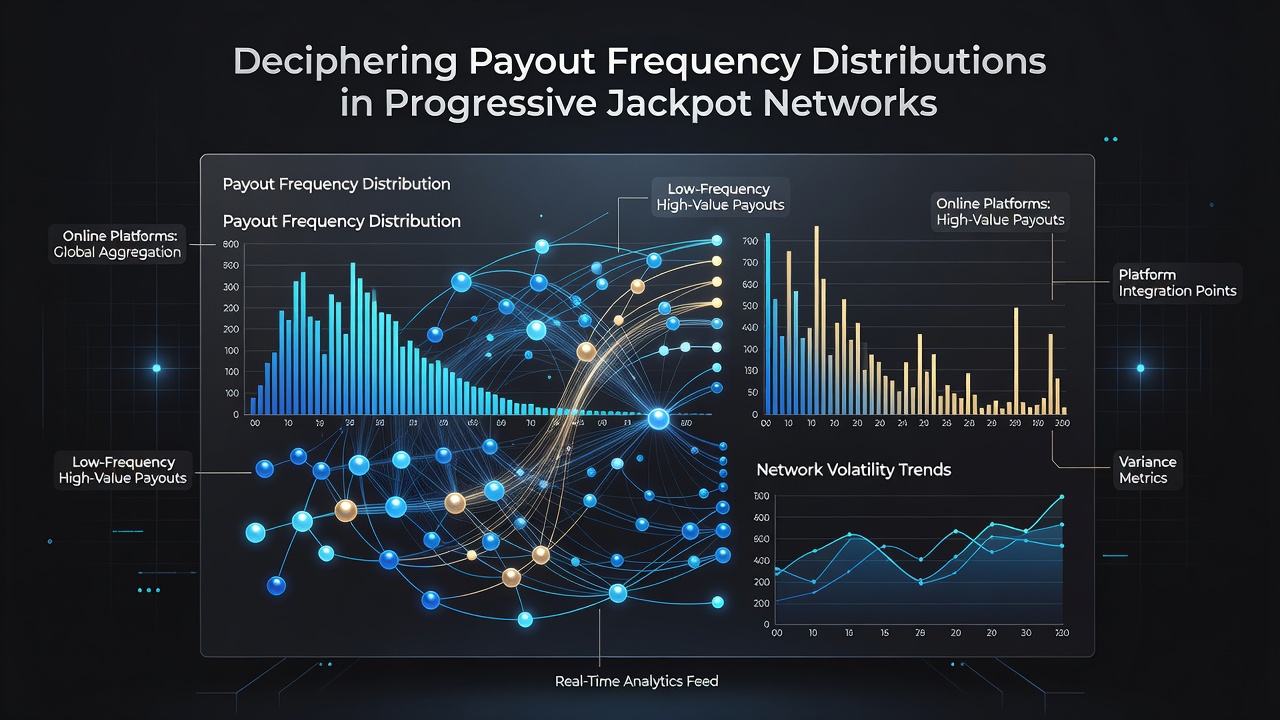
Software tools parse millions of game rounds to produce histograms of payout gaps, and these visualizations show both expected intervals and rare long droughts. Researchers note that network size directly influences variance: larger pools reduce individual platform hit rates yet increase overall prize values, which shifts player behavior toward games with bigger but less frequent rewards.
Regional Variations and 2026 Observations
European operators report different distribution curves compared with North American or Asian platforms because local regulations cap maximum contributions or require minimum seed resets. In June 2026 several networks adjusted their parameters following software updates that refined RNG algorithms, and early logs indicate tighter clustering around predicted intervals on those updated systems.
Academic papers from institutions studying gambling mathematics compare these real-world datasets against theoretical models. One analysis examined three major networks over eighteen months and found that actual payout gaps deviated by less than four percent from simulated expectations once sample sizes exceeded ten thousand jackpot cycles.
Practical Implications for Platform Operators
Operators use frequency data to balance marketing claims about jackpot sizes against responsible gaming messaging. They monitor contribution velocity and adjust marketing spend when intervals stretch beyond historical norms, while compliance teams cross-reference win timestamps with player activity reports to verify that triggers align with licensed parameters.
Third-party auditors sample game code and payout logs to confirm that published hit rates match operational reality. These audits produce reports that feed back into network tuning, allowing operators to recalibrate seed values or contribution percentages when data reveals persistent under- or over-performance.
Conclusion
Payout frequency distributions in progressive networks emerge from the interaction of probability settings, network scale, and regulatory constraints. Ongoing data collection across jurisdictions continues to refine predictive models, and operators apply those insights to maintain both prize growth and system integrity. As networks expand into new markets the patterns will evolve, yet the core statistical relationships remain anchored in the same underlying random processes.