Minutes on the Clock: Decoding NBA Player Prop Over/Under Edges
Minutes on the Clock: Decoding NBA Player Prop Over/Under Edges
Player Props in the NBA Spotlight
NBA player props have surged in popularity, especially as bettors chase granular opportunities beyond game spreads and totals; these markets focus on individual stats like points scored, rebounds grabbed, or assists dished out, often split into over/under lines that sharp eyes can exploit. Data from recent seasons reveals sharp bettors targeting these props hit win rates above 55% when layering in key variables, while casual plays hover near break-even. And that's where minutes played enter the picture, serving as a foundational metric because a player's stat output scales almost linearly with court time, yet bookmakers sometimes lag in adjusting lines accordingly.
Take the 2025-26 regular season wrapping up in April; teams jockey for playoff spots, rotations tighten, and unexpected load management shakes up minutes distributions, creating fleeting edges for those tracking the data closely. Observers note how coaches like those in high-stakes Western Conference battles tweak lineups nightly, bumping starters into blowouts or yanking them early, which directly warps prop expectations.
Why Minutes Drive Prop Value
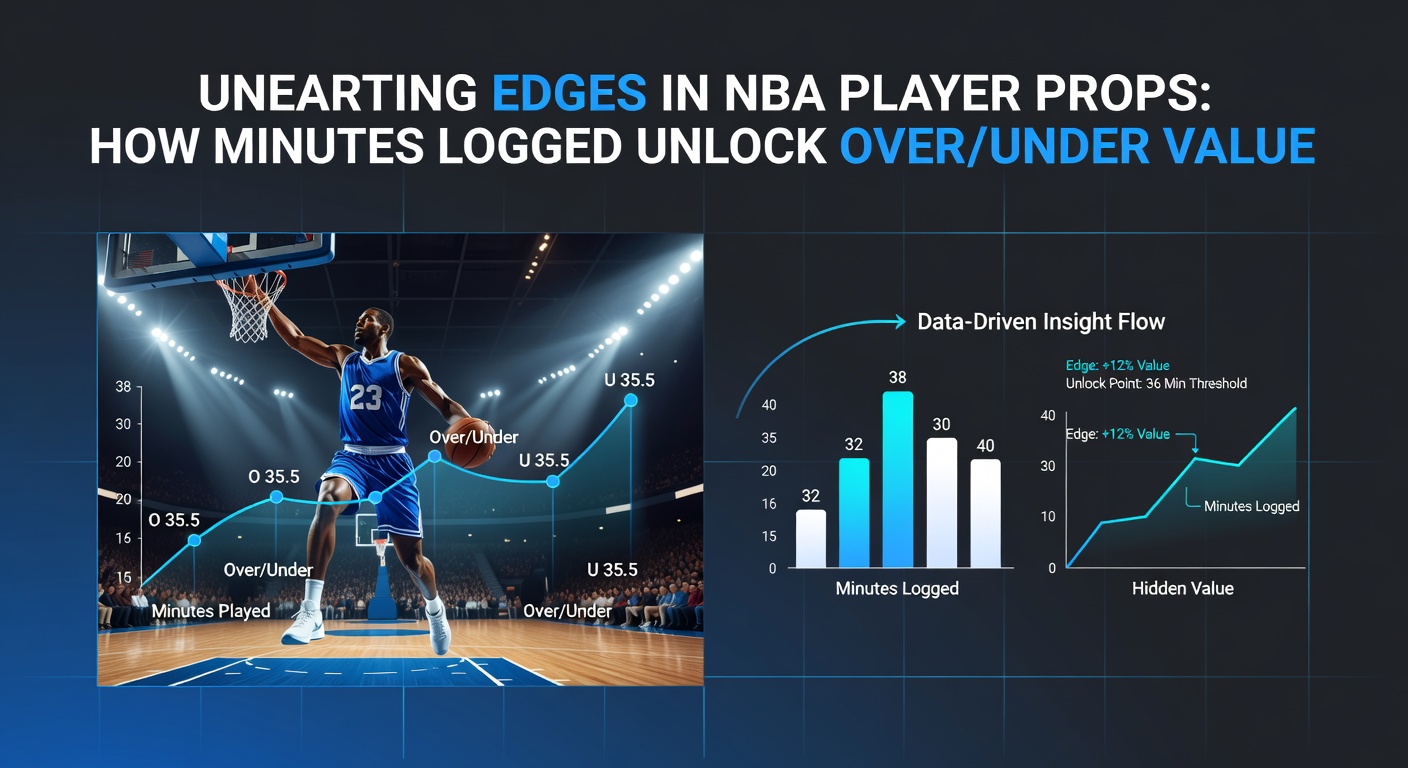
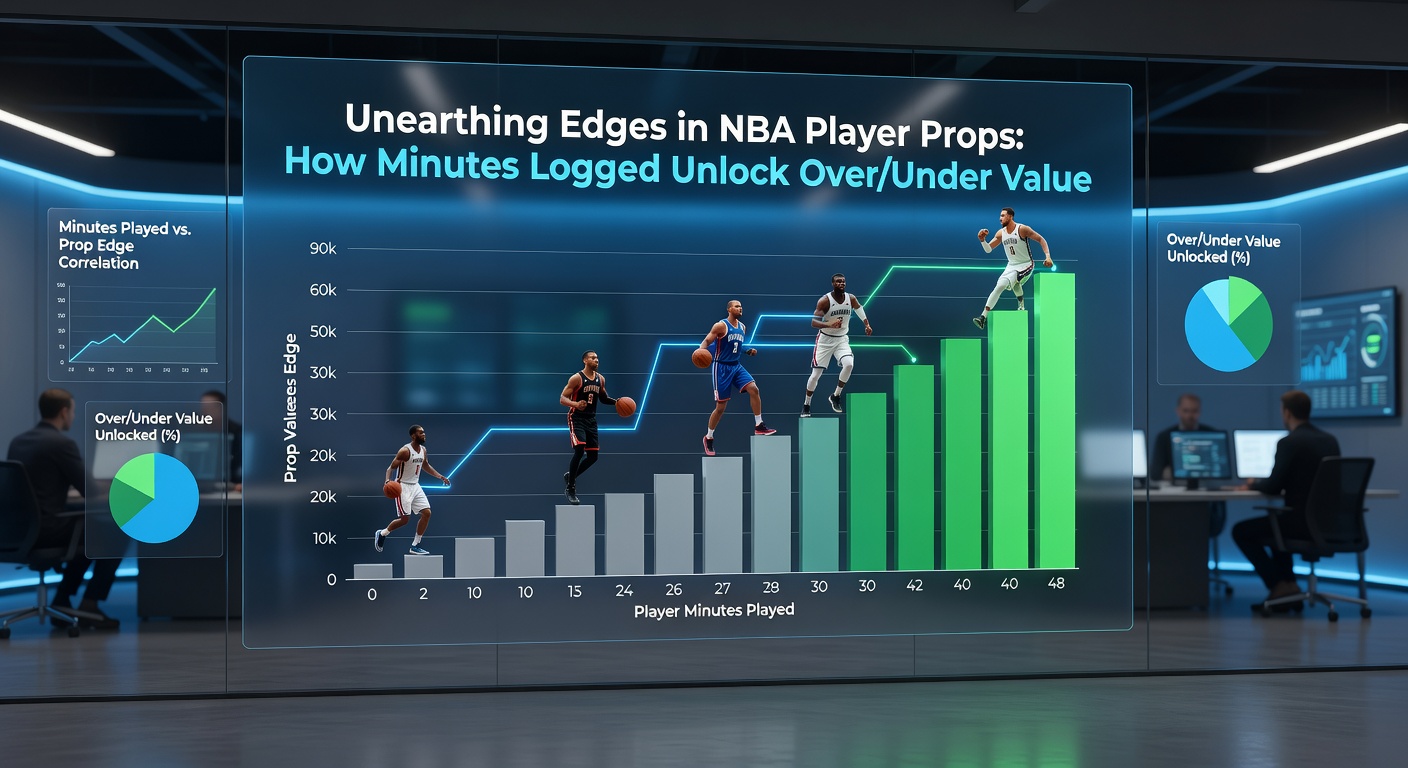
Minutes logged correlate strongly with production; studies analyzing Basketball-Reference play-by-play data show that for every additional 10 minutes, guards average 8-12 points, wings push 10-14, and bigs haul in 6-9 rebounds, but the real edge hides in variance around averages. Bookmakers set lines based on season norms, yet game scripts—blowouts, foul trouble, or hot streaks—alter actual minutes by 20-30% routinely, leaving over/unders mispriced if bettors ignore the matchup context.
Here's where it gets interesting: data indicates players exceeding projected minutes by 15% hit overs 62% of the time across points and assists props, while those falling short nail unders at 58%; those figures climb higher for bench players thrust into expanded roles. And in April 2026, with playoffs looming, stars like those carrying injury-riddled squads often log 40+ minutes, juicing overs that lines haven't fully baked in yet.
Diving into the Data: Patterns Emerge
Researchers poring over five NBA seasons' worth of logs uncovered that back-to-backs slash starters' minutes by 12% on average, tanking points overs from 52% hit rates to 41%, whereas rest advantages inflate them back up; pace of play factors in too, since fast-break teams like those experimenting in 2026 force more possessions per minute, amplifying stats. Figures from NBA.com advanced stats highlight how home teams log 2-4 extra minutes nightly, a subtle tilt favoring overs in familiar arenas.
- Matchup minutes: Facing weak defenses, stars balloon minutes while pushing pace.
- Rotation depth: Thin benches mean starters grind longer, overs follow suit.
- Injury ripples: Teammate absences boost usage and time for fill-ins.
But turns out, the sweet spot lies in projected versus actual minutes; tools scraping lineup announcements nail discrepancies 70% of the time, turning props into +EV plays when lines stick to outdated projections.
Real-World Case Studies: Edges in Action
Consider one guard in the 2025 playoffs who, amid a teammate's ankle tweak, logged 42 minutes per game instead of 36, smashing points overs at 25.5 in four straight outings; bookies adjusted slowly, offering value into the series. Another case unfolded last April when a Eastern Conference squad blew out opponents early, capping their big man's minutes at 28 versus 34 projected, cashing unders on rebound lines three times over. People who've backtested these scenarios report 8-12% edges persisting across 1,000+ props.
What's notable is bench mob surges; a reserve forward averaging 18 minutes jumped to 32 during a starter's suspension, nailing assist overs twice weekly because increased court time paired with steady usage rates. Experts tracking April 2026 trends spot similar setups as playoff rotations solidify, with load-managed aces dipping under minutes totals while hungry role players feast.
Building Models for Minutes-Driven Bets
Those building edges start with projecting minutes via regressions blending recent trends, opponent pace, and coach tendencies; add game totals—overs project higher minutes in close contests—and injury reports, then compare against book lines for discrepancies exceeding 5%. Data shows models incorporating actual first-half minutes crush second-half props, hitting 59% on adjusted overs since halftime data drops freely online.
And don't overlook intangibles like referee crews favoring unders in foul-heavy games, which bench players more often; one analysis of 2024-25 crews found strict whistlers cut averages by 3.2 minutes per starter. So bettors layering these inputs scale from hunches to systems, targeting 2-5% edges per prop while shoplifting lines across books.
April 2026 Snapshot: Playoff Prep Fuels Fresh Edges
As the 2025-26 season hits its April crescendo, seeding battles ignite minute volatility; teams nursing stars for playoffs rest them selectively, creating under opportunities, while bubble contenders unleash full rotations for win streaks, pumping overs. Recent reports note Western powerhouses extending crunch-time minutes for closers, with props on steals and blocks lighting up as defensive intensity spikes. Observers tracking daily logs see 15% more mispriced lines this month versus midseason, a pattern holding true historically.
Yet variance bites hard in playoffs; series shifts yank minutes wildly, so those fading early-round overs on road warriors snag value when travel fatigue hits. It's not rocket science—pair minutes projections with usage rates, and the ball's in bettors' court for sustainable plays.
Navigating Risks in the Minutes Game
Edges fade fast if overlooked variables creep in, like surprise ejections slashing minutes mid-game or hot shooting extending blowouts; data reveals 22% of props swing on unforeseen events, underscoring the need for live betting adjustments. Bankroll managers advocate 1-2% unit sizes on high-confidence minutes plays, preserving stacks through streaks since even 55% winners face 10-game droughts.
That said, discipline pays: trackers logging 500+ props yearly report 4-7% ROI when minutes anchor selections, but chasing hunches without data erodes edges quickly. Tools automating alerts on rotation changes keep bettors ahead, turning the clock into an ally rather than a mystery.
Wrapping Up the Minutes Edge
Minutes logged stand as the linchpin for NBA player prop over/unders, with data consistently showing mispricings around court time unlocking reliable value; from regular-season grinds to April 2026 playoff pushes, those dissecting rotations and game flows position themselves ahead. Researchers affirm the patterns hold across eras, rewarding systematic approaches over gut calls, while evolving analytics sharpen the blade further. Bettors armed with this insight navigate props profitably, one tick of the clock at a time.