Statistical Modeling Techniques for Loyalty Tier Progression in Regulated Online Platforms
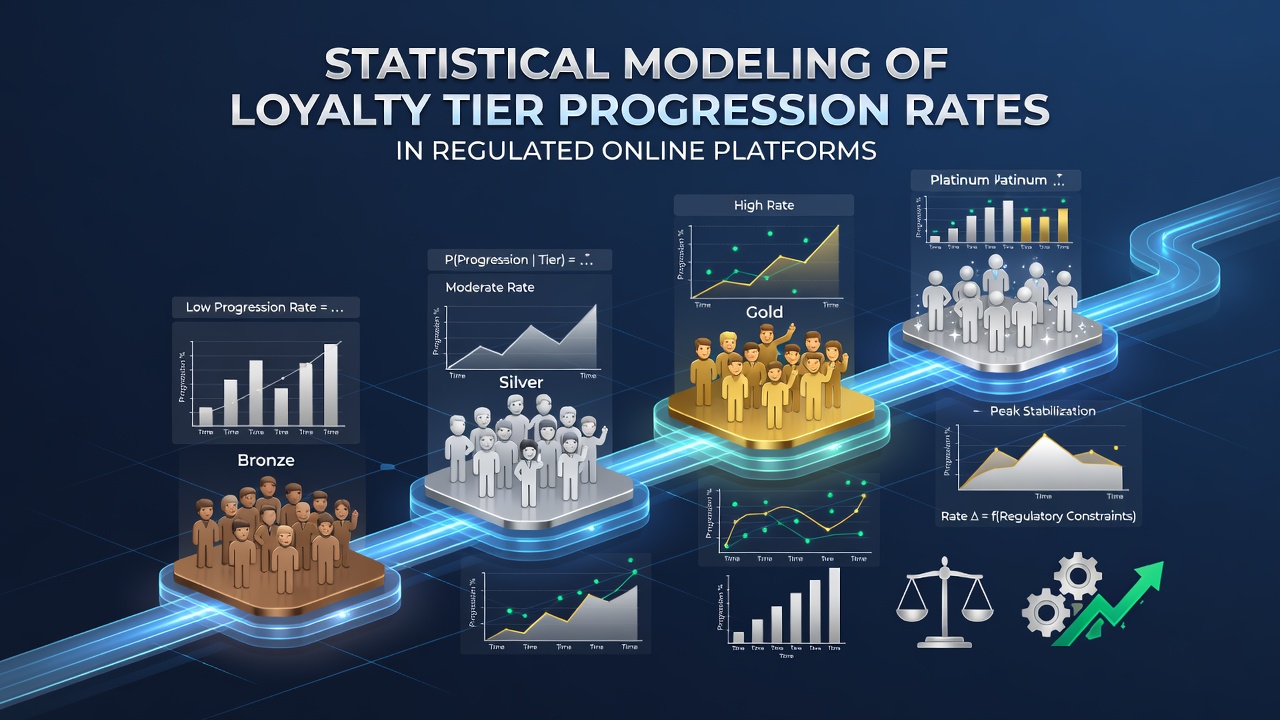 Regulated online platforms rely on structured loyalty programs to maintain user engagement, and statistical modeling provides the framework for predicting how participants advance through tier levels based on behavioral data. These models incorporate variables such as transaction frequency, session duration, and reward redemption patterns to estimate progression probabilities across different user segments. Platforms in sectors including e-commerce, digital services, and financial technology apply these techniques to optimize program design while adhering to data protection regulations that govern information handling. Data collection forms the foundation of any progression analysis, with platforms logging anonymized user activities through secure systems that comply with standards like those enforced by the Federal Trade Commission in the United States. Analysts aggregate metrics including purchase volumes, interaction rates, and time spent in app environments, then structure this information into datasets suitable for time-series examination. Researchers often segment cohorts by acquisition channel or demographic indicators to isolate factors that accelerate or hinder tier advancement.
Core Modeling Approaches
Markov chain models represent one established method for simulating tier transitions, where each state corresponds to a loyalty level and transition probabilities derive from historical movement data. Platforms calculate these probabilities by dividing observed upgrades by total opportunities within a given period, which allows forecasting of future distributions across tiers. Logistic regression supplements this approach by incorporating predictor variables such as average spend per visit and recency of activity, producing individualized likelihood scores for reaching the next threshold.
Survival analysis techniques extend these capabilities by treating tier progression as a time-to-event outcome, estimating hazard rates that reflect how quickly users achieve advancement under varying conditions. Cox proportional hazards models, for instance, adjust for covariates while maintaining the proportional assumption that relative risks remain consistent over observation windows. Data from multiple platforms indicates these models achieve higher accuracy when updated quarterly with fresh behavioral logs.Integration of Machine Learning Elements
Ensemble methods including random forests and gradient boosting machines handle non-linear relationships and interaction effects among dozens of features extracted from user profiles. Feature importance rankings from these algorithms highlight engagement velocity and cross-category participation as consistent drivers of rapid tier movement. Platforms validate model performance through cross-validation procedures that split datasets into training and testing subsets, ensuring predictions generalize beyond the sample used for calibration.
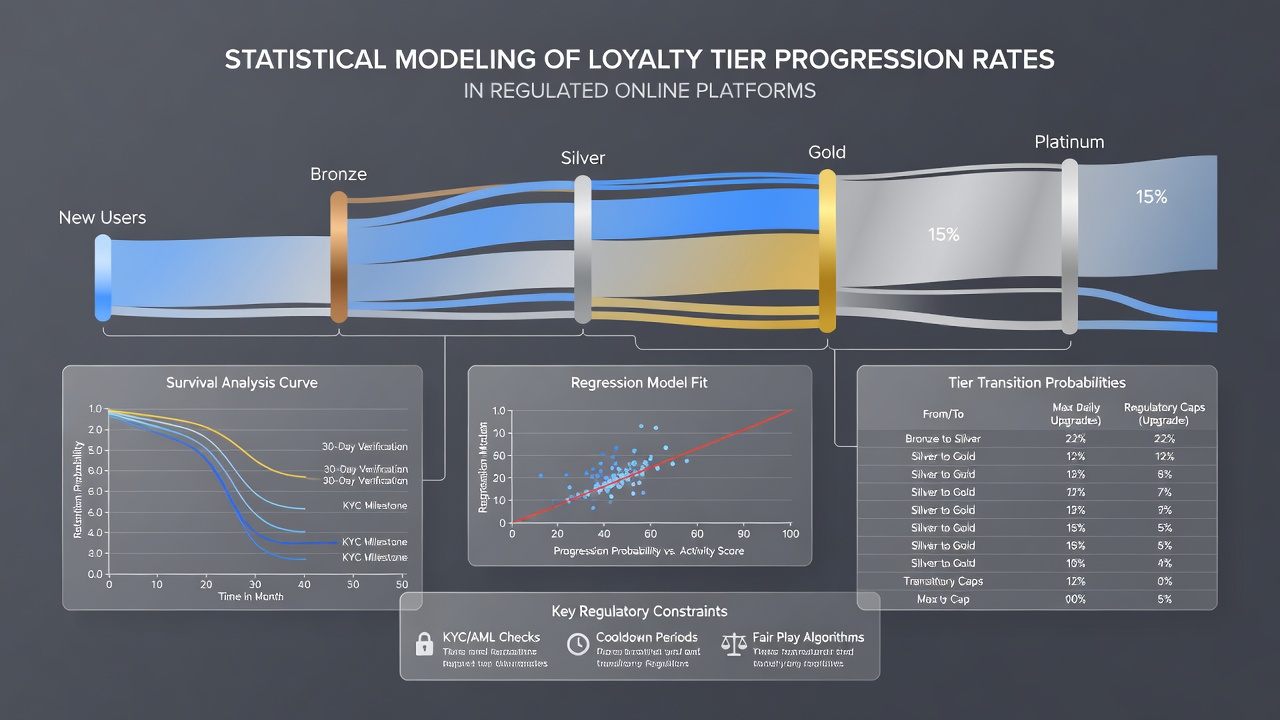 As of July 2026, several major platforms reported deploying hybrid models that combine traditional survival frameworks with neural network components to capture sequential patterns in user journeys. These implementations process streaming data feeds in near real time, updating progression forecasts as new transactions arrive. Industry reports from organizations such as the Federal Trade Commission note increased scrutiny on how such models incorporate consent mechanisms for data processing.
Regulatory and Operational Considerations
Compliance requirements shape model development because regulations restrict the types of personal attributes that can enter predictive equations. Analysts therefore emphasize behavioral proxies rather than direct identifiers, applying techniques like differential privacy to aggregate statistics before model training begins. European platforms additionally align outputs with guidelines from bodies overseeing digital services, which emphasize transparency in automated decision systems affecting user rewards.
Validation studies compare model predictions against actual tier movements observed in subsequent months, revealing calibration drift when external factors such as seasonal promotions alter baseline behaviors. Teams recalibrate coefficients periodically and test alternative specifications including competing risks frameworks that account for users who exit the platform before reaching higher tiers.Practical Implementation Examples
One financial services platform applied a multi-state Markov model to its rewards program and identified that users completing three consecutive monthly challenges progressed to premium tiers at rates three times higher than those with sporadic activity. Another digital marketplace used survival curves stratified by device type to show mobile-first participants reached elite status faster on average than desktop-dominant cohorts. These findings informed targeted communications that increased overall progression rates without violating fairness provisions in applicable consumer protection statutes.